Science meets Art
I like to combine data visualization in R with graphical illustration in Adobe Illustrator to communicate scientific concepts or events. Here are a handful visuals that I’ve made.
A prolactin-driven transcriptional symphony of parental care
Fliers for the 2018 Data Commons Pilot Phase Consortium (2018)
A summary of a global instructor training event (Nov 2018)
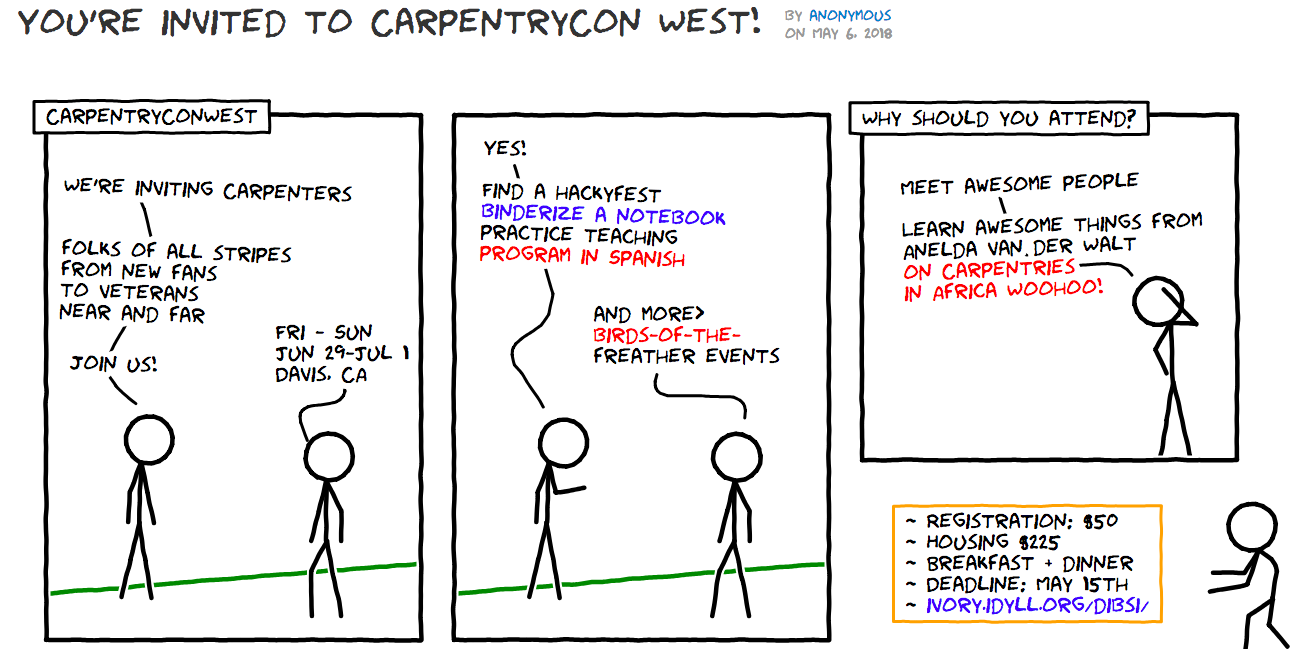
A bioinformatics workshop announcement (May 2018)
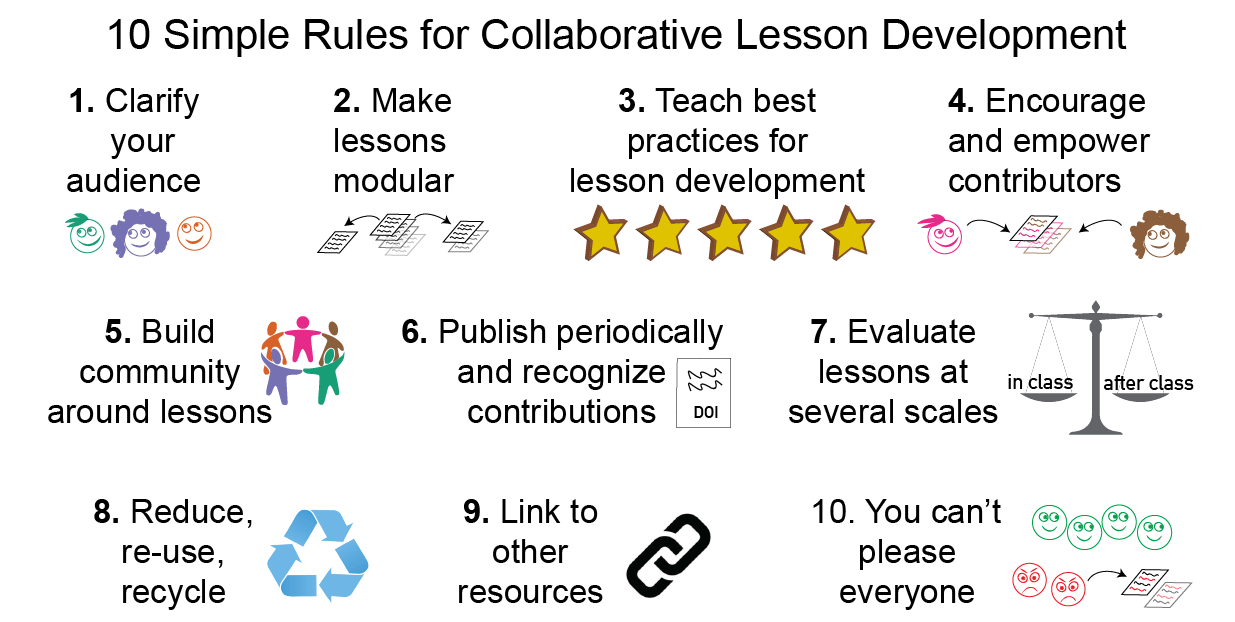
A graphical abstract a manuscript about collaborative teaching (March 2018)
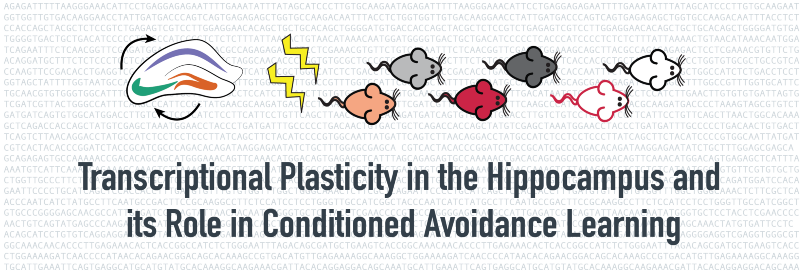
A graphical abstract of my PhD thesis (Oct 2017)
A poster about a neuroscience course (Nov 2014)